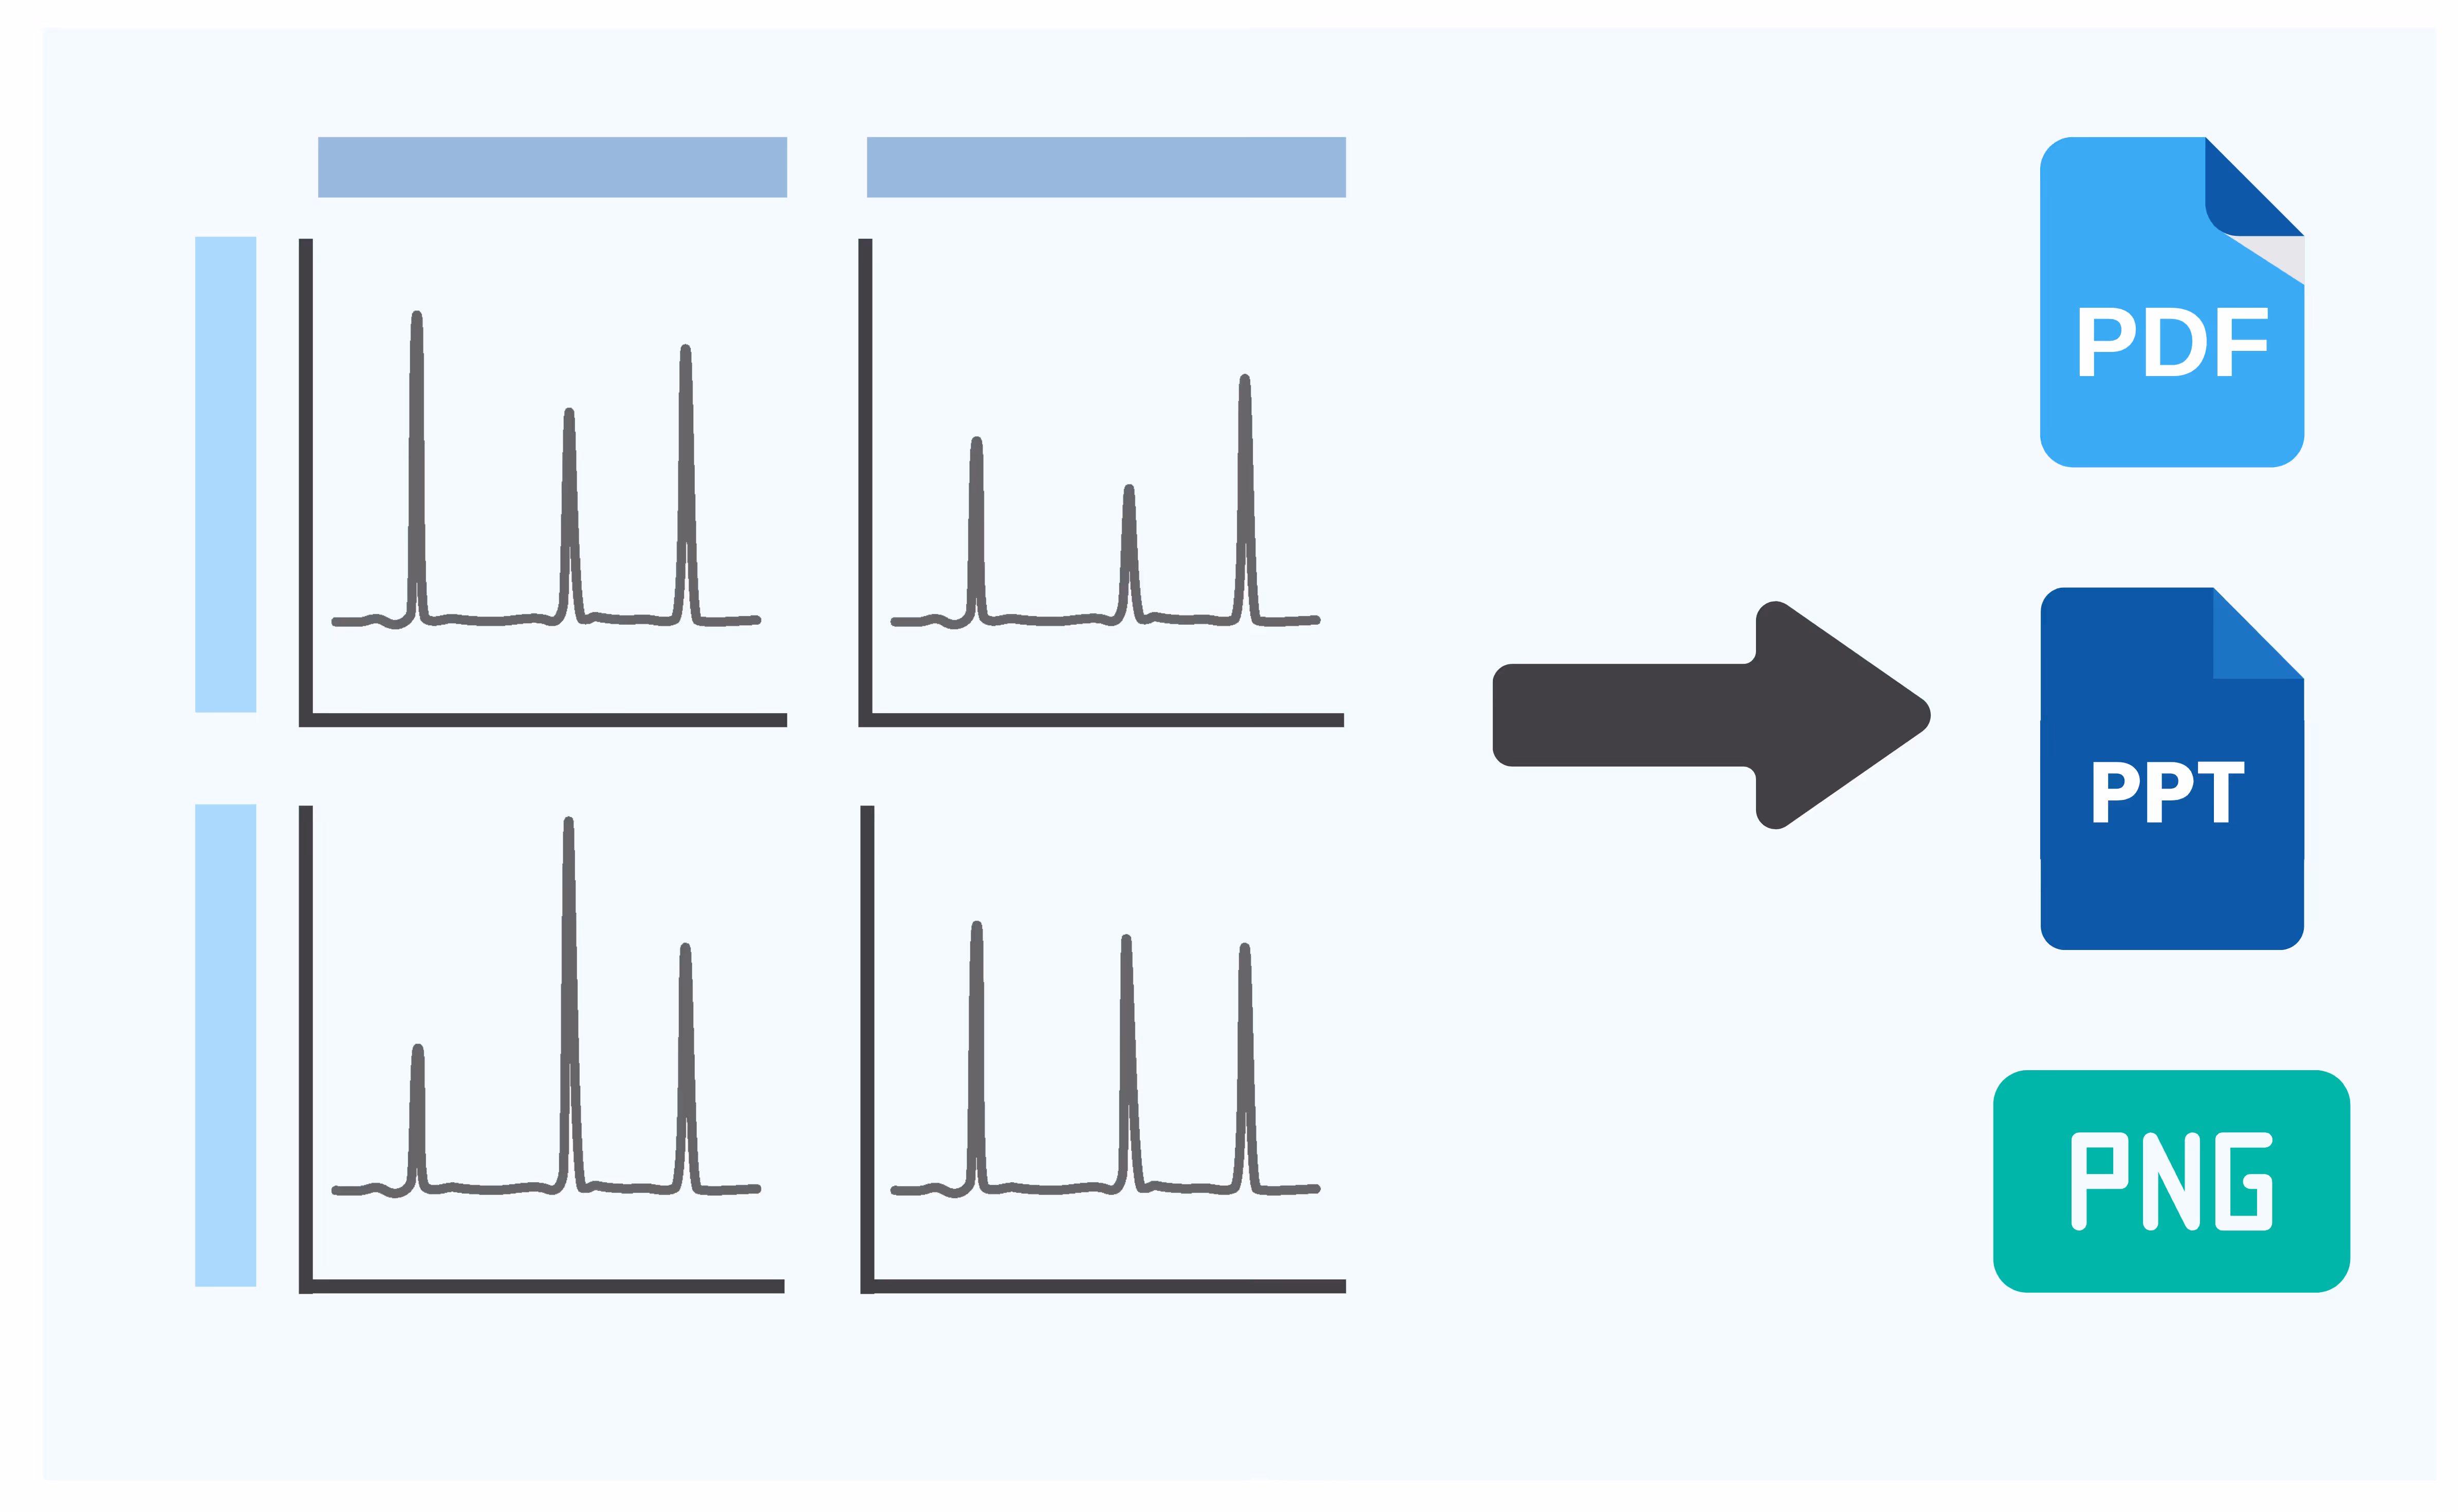
PDF 格式

PPTX

PNG

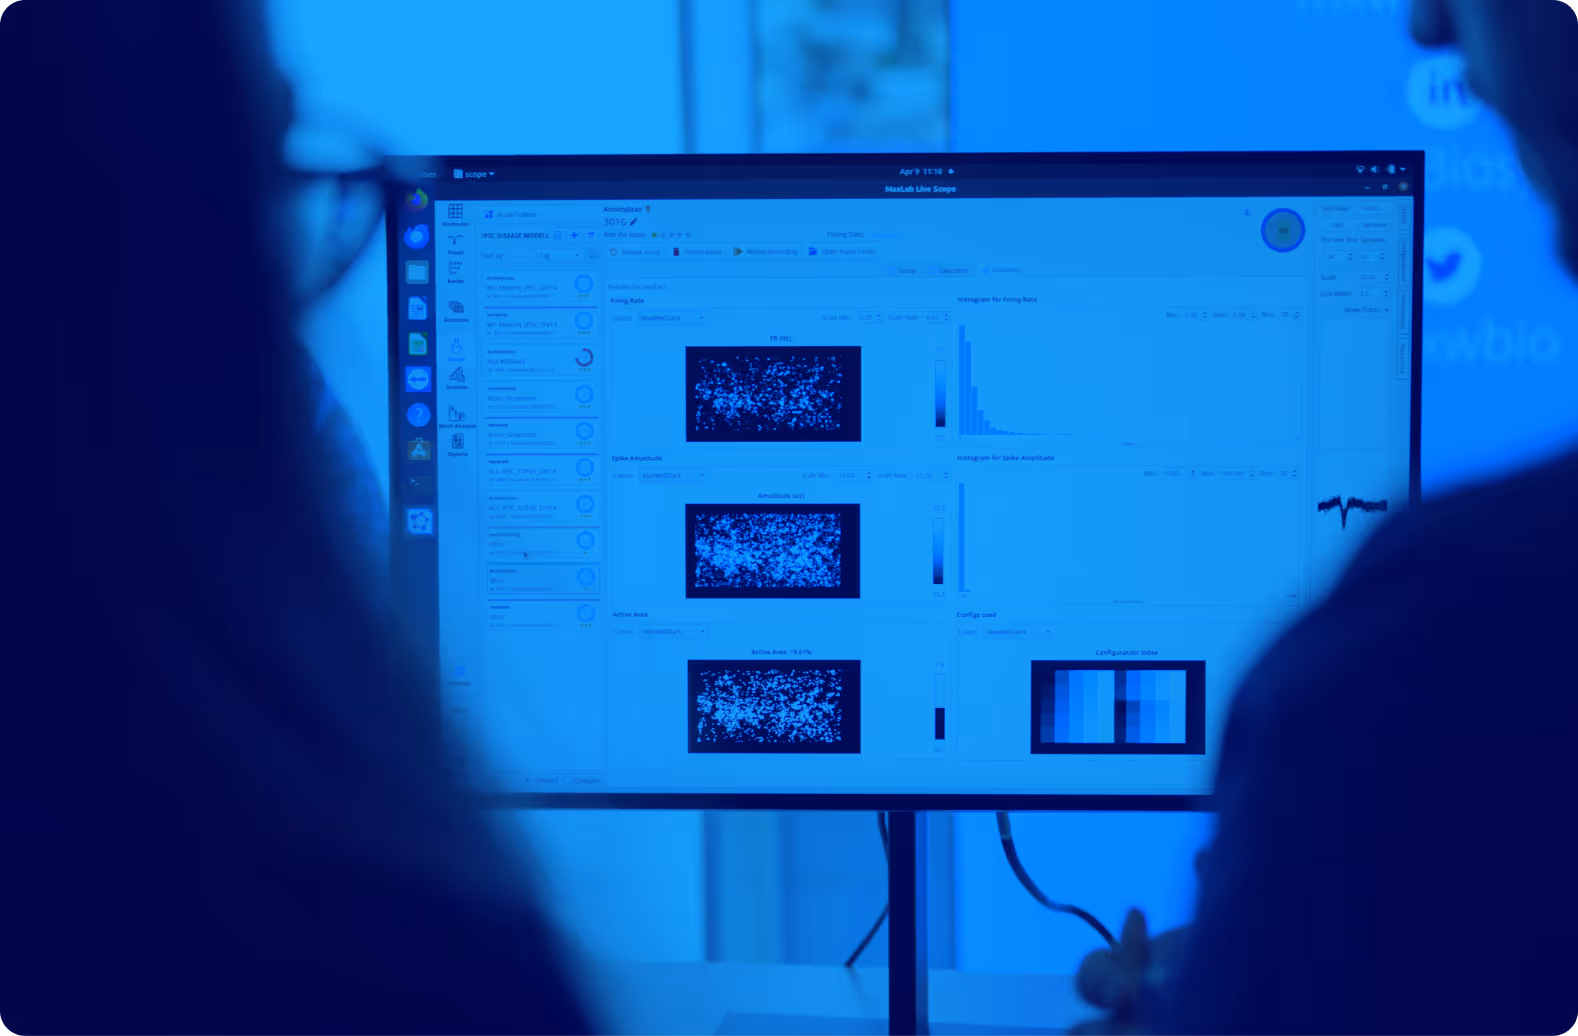
The all-in-one software for recording, analyzing, and interacting with biological samples on MaxOne and MaxTwo HD-MEA systems.
MaxLab Live 26.1 expands the all-in-one software platform for high-content electrophysiology with new analysis capabilities designed to make richer MEA data characterization accessible by default. Enabled by the resolution and data quality of HD-MEA recordings, the following novel readouts help reveal functional phenotypes that conventional MEA analysis miss:
Go beyond beat detection with rhythm, propagation, and waveform readouts.
Reveal subtle network differences from the full shape of each burst.
Novel methods to characterize population activity and temporal dynamics.
Together with parameter-free workflows, and customizable metric exports, this release helps researchers extract deeper insights from every recording while simplifying the path from acquisition to analysis and export.


实时和高分辨率探索细胞活性
在不影响数据质量的情况下提高吞吐量。每口井有 26,400 个电极,密度为 3,265 个电极/mm²,在整个板块上保持单电池和亚细胞分辨率。
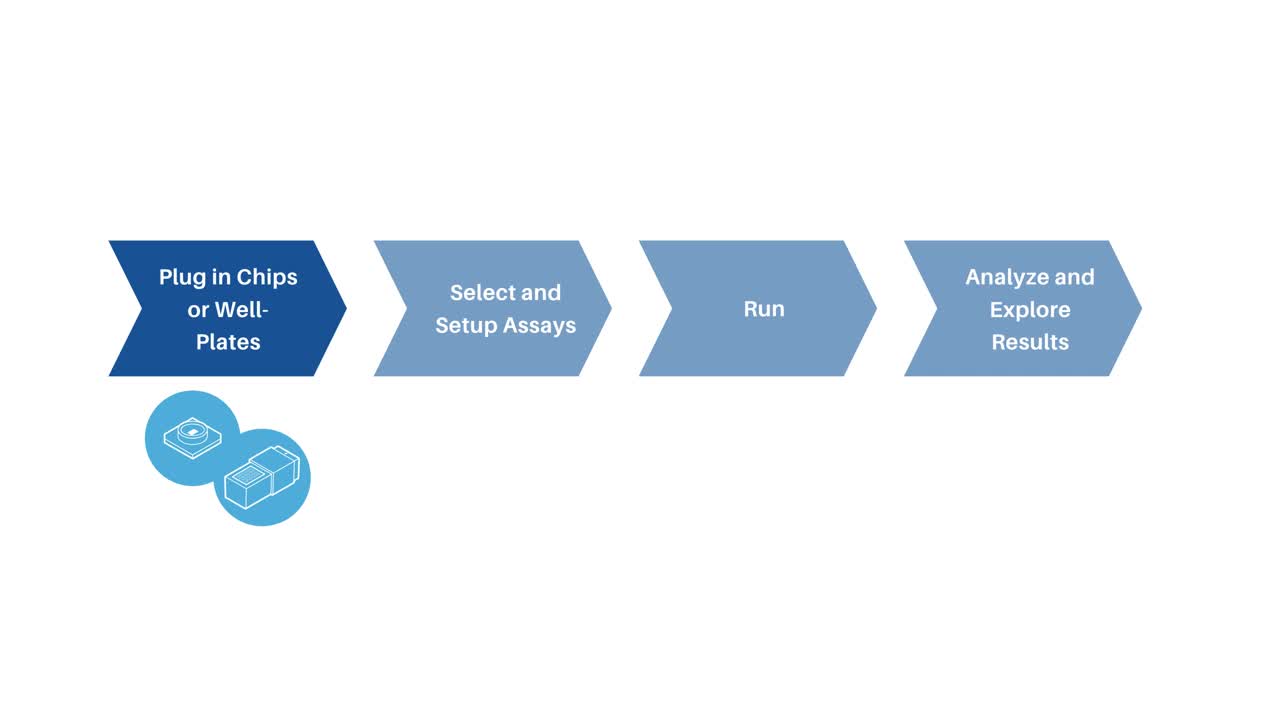
轻松采集电生理数据
记录生物学相关数据对于充分了解您的模型至关重要。通过直观而简化的工作流程轻松捕获高质量、高内容的数据集。
通过电刺激与细胞互动
与电细胞互动是了解网络如何处理和适应输入的关键。应用有针对性的、可定制的电刺激方案,并观察人群发生的反应。
轻松地跨尺度提取标准和新颖读数
将丰富的电生理学数据转化为切实可行的见解需要轻松、可靠地访问最相关的读数。使用自动分析工具提取关键生理特征,将复杂数据转换为随时可用、具有出版质量的结果。
将复杂的电生理学转化为直观的体验。MaxLab Live 通过针对特定应用量身定制的优化、即用型检测,简化并简化了实验工作流程。将检测结果整合到简化的实验管道中,以实现最有效的记录策略,并从生物样本中发现有意义的新颖数据。
MaxLab Live Assays 是预定义的、可重复使用的实验模板,可指导用户完成结构化的工作流程:配置记录策略,使用一致的设置进行实验,并通过直观的可视化结果检查结果。这个可重复的框架支持科学严谨性,同时节省了设置和分析的时间。
检测可以独立运行,也可以在同一会话中组合使用,从而可以在保持一致性的同时自定义工作流程。配置完成后,实验可以在后台运行,从而腾出时间执行其他任务。
每项检测都是专门设计的,考虑了特定的实验目标。优化的数据采集和分析策略可确保毫不费力地捕获、处理、汇总和导出相关的高质量数据。

神经元具有自发放电活动吗?
它们分布在芯片上的什么位置?
精确识别您的细胞所在位置并描述其活动模式。
彻底检查样本的活性,以评估健康状况、覆盖范围和进一步实验的准备情况。

放电频率热图,说明芯片上的整体神经活动。
![Heatmap showing amplitude levels with color scale from blue (low) to red (high) labeled 'Amplitude [uV]'.](https://cdn.prod.website-files.com/686b5e0d1e85939ee7bacc64/687c8268216fcb9d157552e9_d75b18941320cdcc8c4af50d94e01e05_Section1_4_1_ActivityScan_Image2_amplitudeMap.avif)
放电幅值热图,显示整个芯片的整体信号强度。
细胞之间是否形成网络连接?
借助优化的记录策略,可以毫不费力地评估和量化群体网络中相互连接的许多神经元的同步活动模式。
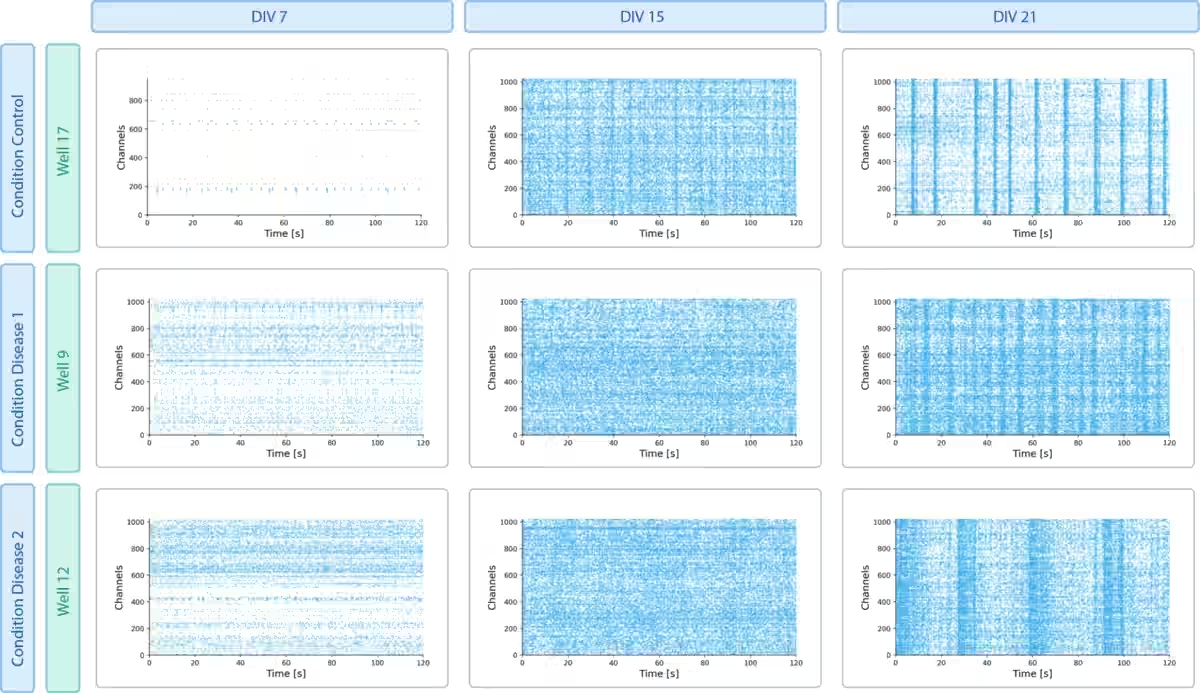
跟踪一段时间内不断变化的网络动态,以监控样本的成熟度。
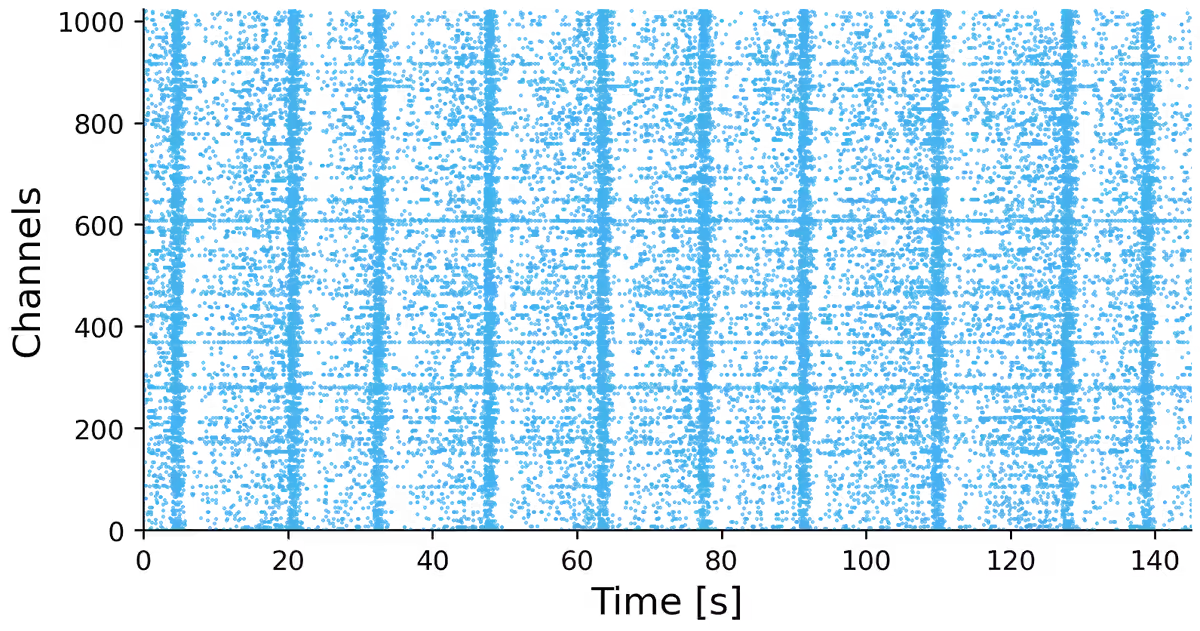
神经活动的栅格图。每个蓝点都标志着给定记录电极上的尖峰。这揭示了记录的神经元的总体发射动态。
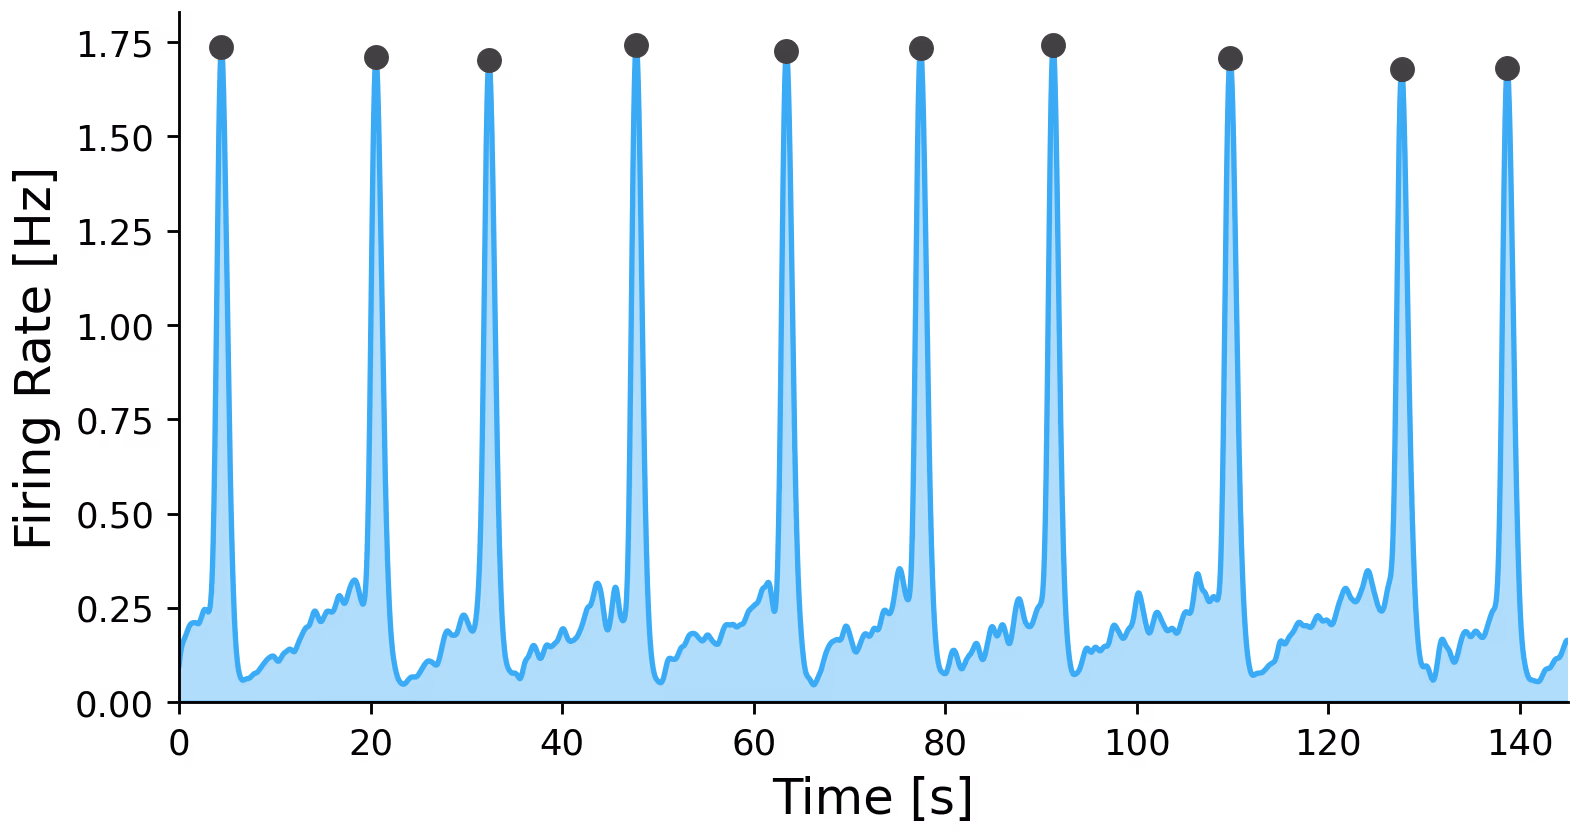
平滑的射速追踪显示了整体活动如何随着时间的推移而变化。标有黑点的峰值会突出显示网络爆发。
你的细胞对电刺激有何反应?
Evoked Activity Characterization
精确识别您的细胞所在位置并描述其活动模式。
超越自发活动,描述样本的电诱发活性模式。
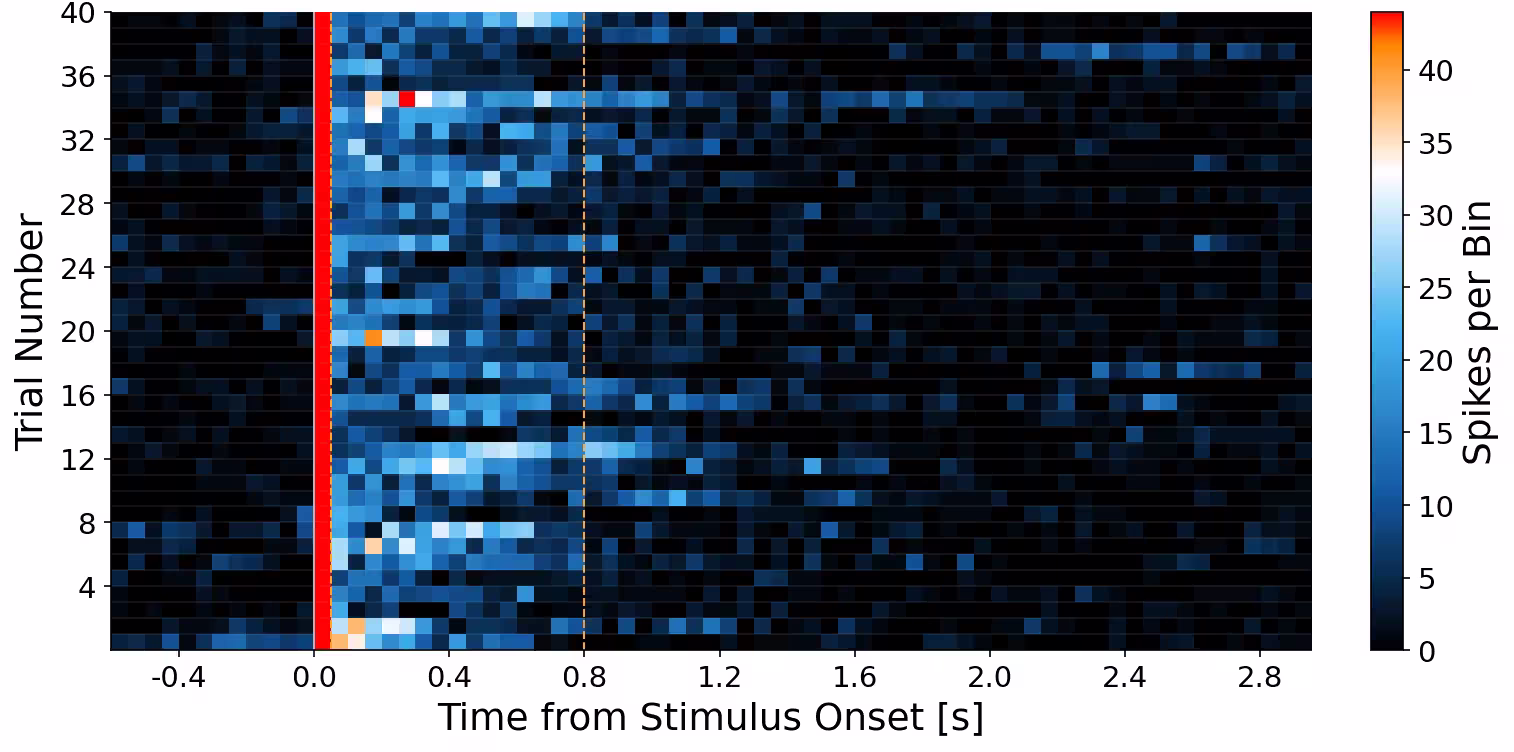
Peristimulus 时间直方图显示了神经元在多项试验中对电刺激的反应。颜色表示激发的尖峰次数,突出显示刺激后活动的增加。
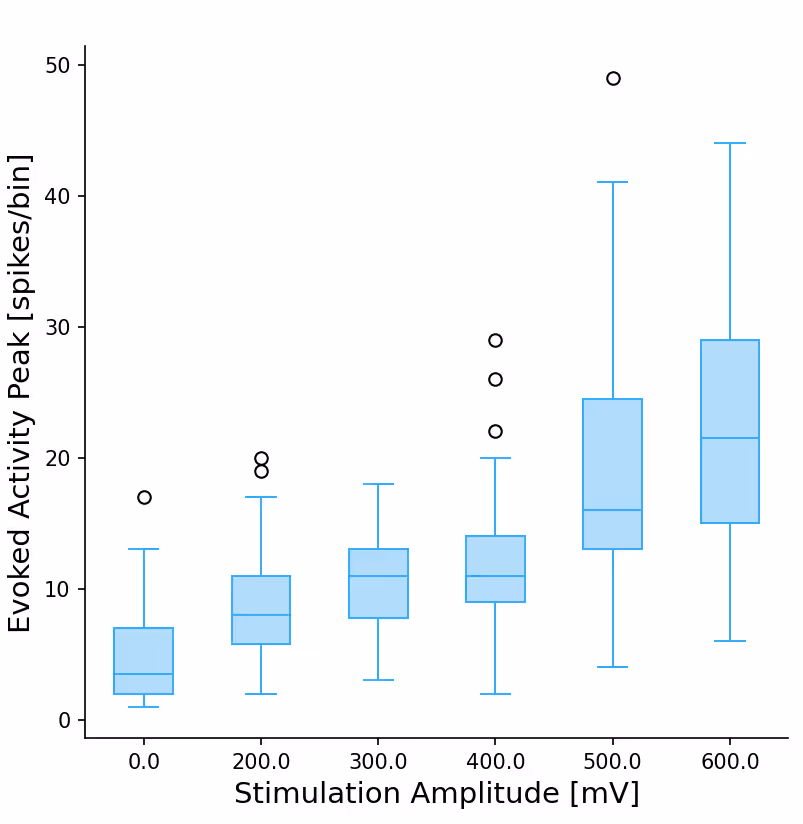
方框图说明了诱发反应强度如何随刺激振幅而变化。更强的刺激会激发更强的神经活动。
信号如何通过神经元轴突传播?
通过跟踪细胞的动作电位传播,无需染料或额外的样品制备即可实现轴突分支的可视化。
研究动作电位在细胞中传播的速度。
Axon Tracking Assay 记录了多个神经元。等高线图显示了它们检测到的信号,红线表示动作电位沿轴突的传播。
以高分辨率记录在MEA中传播的单个神经元的轴突动作电位。
利用 MaxLab Live 的高通量数据管理和分析功能,简化扩大实验的复杂性。并行、高效、可靠地组织、分析和共享数百个实验的结果。

使用 “注释” 选项卡轻松处理大规模实验。跨时间点、治疗条件或自定义分组标记、筛选和结构化数据。所有记录保持连接、可搜索和结构化,便于在 MaxLab Live 和自定义管道中进行下游分析。
对多个数据集应用一致的分析管道,并在 MaxLab Live 中同时运行所有分析。只需点击几下,即可进行批量分析、导出汇总指标、进行质量检查或探索单个油井。
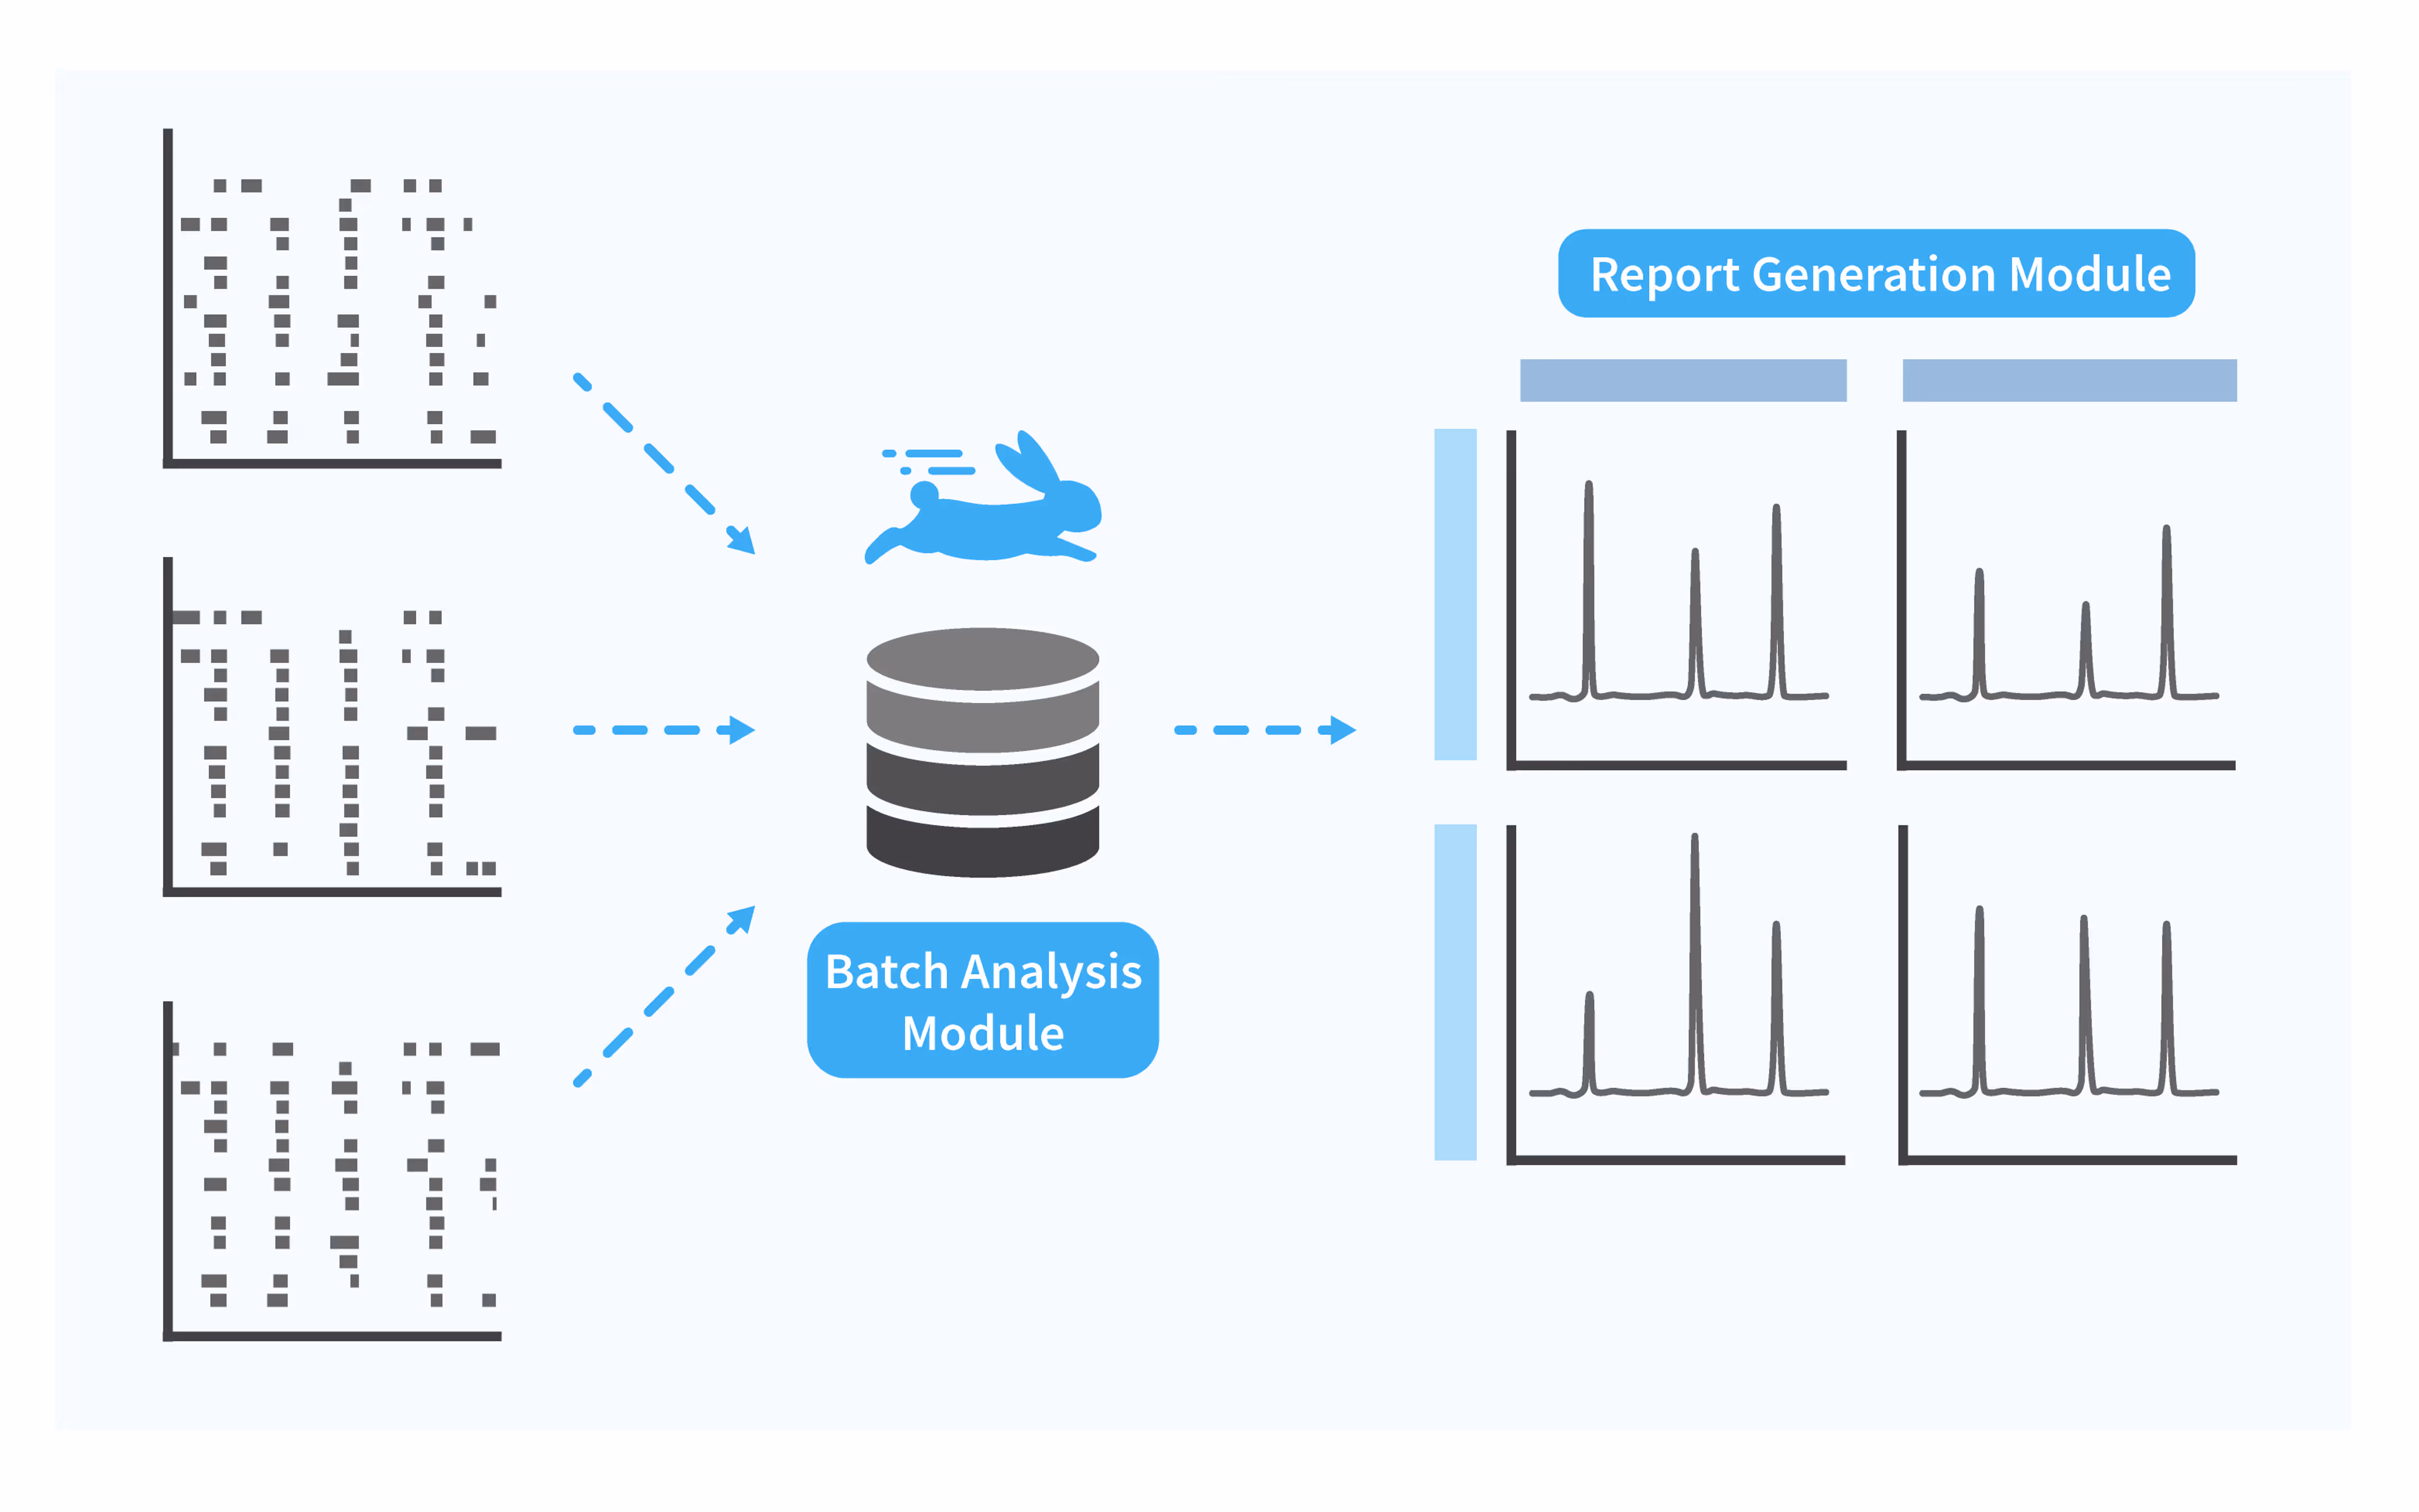
自动为整个实验生成结构化报告,包括绘图、表格和注释。

MaxLab Live API 为使用 MaxWell Biosystems 的高密度微电极阵列 (HD-MEA) 系统进行可编程、集成和自适应实验打开了大门。从构建实时闭环系统到部署自定义刺激协议,API 为电生理实验提供了无与伦比的灵活性和控制力。
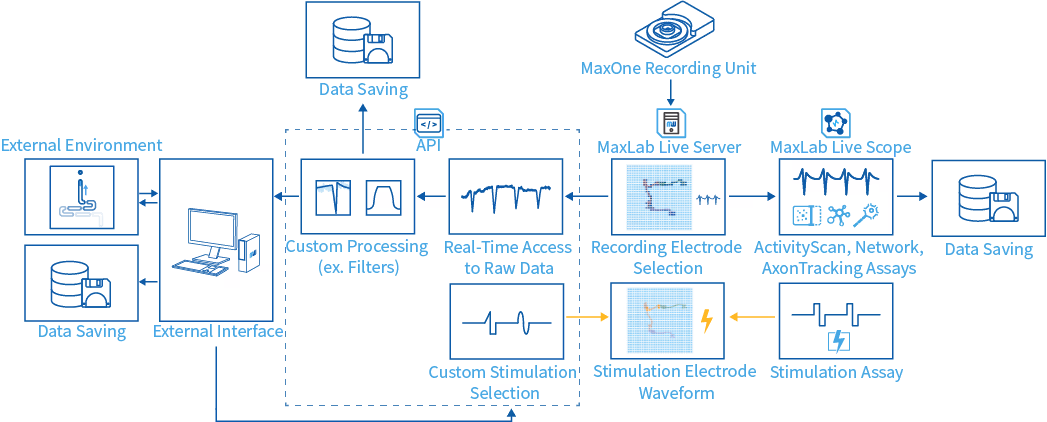
实时访问原始数据流,在峰值、突发或用户定义的事件发生时对其进行检测。通过实时反馈实现响应式实验。
设计和执行针对特定研究问题量身定制的可编程刺激方案。精确控制电极选择、波形参数和定时。
启用 maxLab Live 与外部硬件或软件平台之间的高级集成。该 API 支持实时通信和同步的多模式工作流程,包括与实验室自动化系统进行协调,实现无缝的即插即用操作。
为信号处理、自适应刺激或反馈回路等开发自定义逻辑。无论是实现实时事件检测还是复杂的循环条件,MaxLab Live API 都能满足高级实验需求。

“The Batch Analysis and Report Generation modules are heaven on earth. They make handling massive datasets feasible and cut our workload by 20-fold or more. Feeding results directly into reports streamlined our work, even for small projects, and the auto-generated PDF really boosted our QC. It truly saved us!”
.avif)
“We use the Activity Scan and Network Assay to track the dynamic changes in activity maps of growing networks of human iPSC-derived neurons over time. We found that these changes in activity image match well with dynamics of growing network morphology. This is only possible by High-Density MEAs like MaxOne Chip and user-friendly MaxLab Live Software provided by MaxWell Biosystems.”
.avif)
“With MaxLab Live Software we analyze the neuronal network firing rate and network bursting phenotypes. We also use the AxonTracking Assay to analyze the neuronal branches and their functionality at the single cell level.”

“The built-in analysis module was the best part of the MaxLab Live Software. I have little to no experience with analyzing this type of dataset and no familiarity with programs like R and MATLAB. The ability to easily analyze data with the MaxLab Live Software was wonderful, with suggested defaults, multiple export runs in single files and further data wrangling and graphing.”