Hundreds of Recordings, One Workflow: Large-Scale HD-MEA Analysis with MaxLab Live

From individual HD-MEA recordings to large-scale studies, MaxLab Live brings data acquisition, advanced analysis, visualization, and reporting together in one integrated platform. Discover how MaxLab Live 26.1 expands functional readouts and streamlines data handling, helping researchers turn complex electrophysiology datasets into meaningful insights.
Author
Date
Tags
From data to insights: high-content electrophysiology with MaxLab Live
MaxLab Live is MaxWell Biosystems' all-in-one software for high-content electrophysiology, integrating data acquisition, visualization, stimulation, advanced analysis, and export.
MaxLab Live 26.1 further expands these capabilities, introducing new analysis tools and additional options for managing large datasets. New Network Burst Shape Metrics characterize how neuronal network bursts rise, peak, and decay, while dedicated Cardiac Analysis provides readouts of cardiac rhythm, propagation, and field potential waveforms.
But extracting meaningful metrics from individual recordings is only part of the challenge. As experiments grow across wells, conditions, and timepoints, researchers also need efficient ways to manage, compare, and analyze their data.
In this article, we explore how MaxLab Live supports large-scale HD-MEA studies, from organizing hundreds of recordings to analyzing results consistently, generating reports, and exporting data for downstream analysis.
What makes analyzing large-scale HD-MEA studies challenging?
Each HD-MEA recording holds a lot of information: whichever assay you run, it captures activity across thousands of electrodes and yields a rich set of metrics per well. Most studies, however, don't stop at one recording. They follow several cell lines, treatments and doses across weeks of development on multi-well plates, and quickly add up to hundreds of recordings.
At that scale, working with the dataset as a whole becomes the challenge: keeping track of what each recording represents, analyzing all of them consistently, understanding the results across conditions and time, and getting the numbers into the tools used for statistics.
Handling such datasets comes down to four steps: Organize, Analyze, Overview and Export.
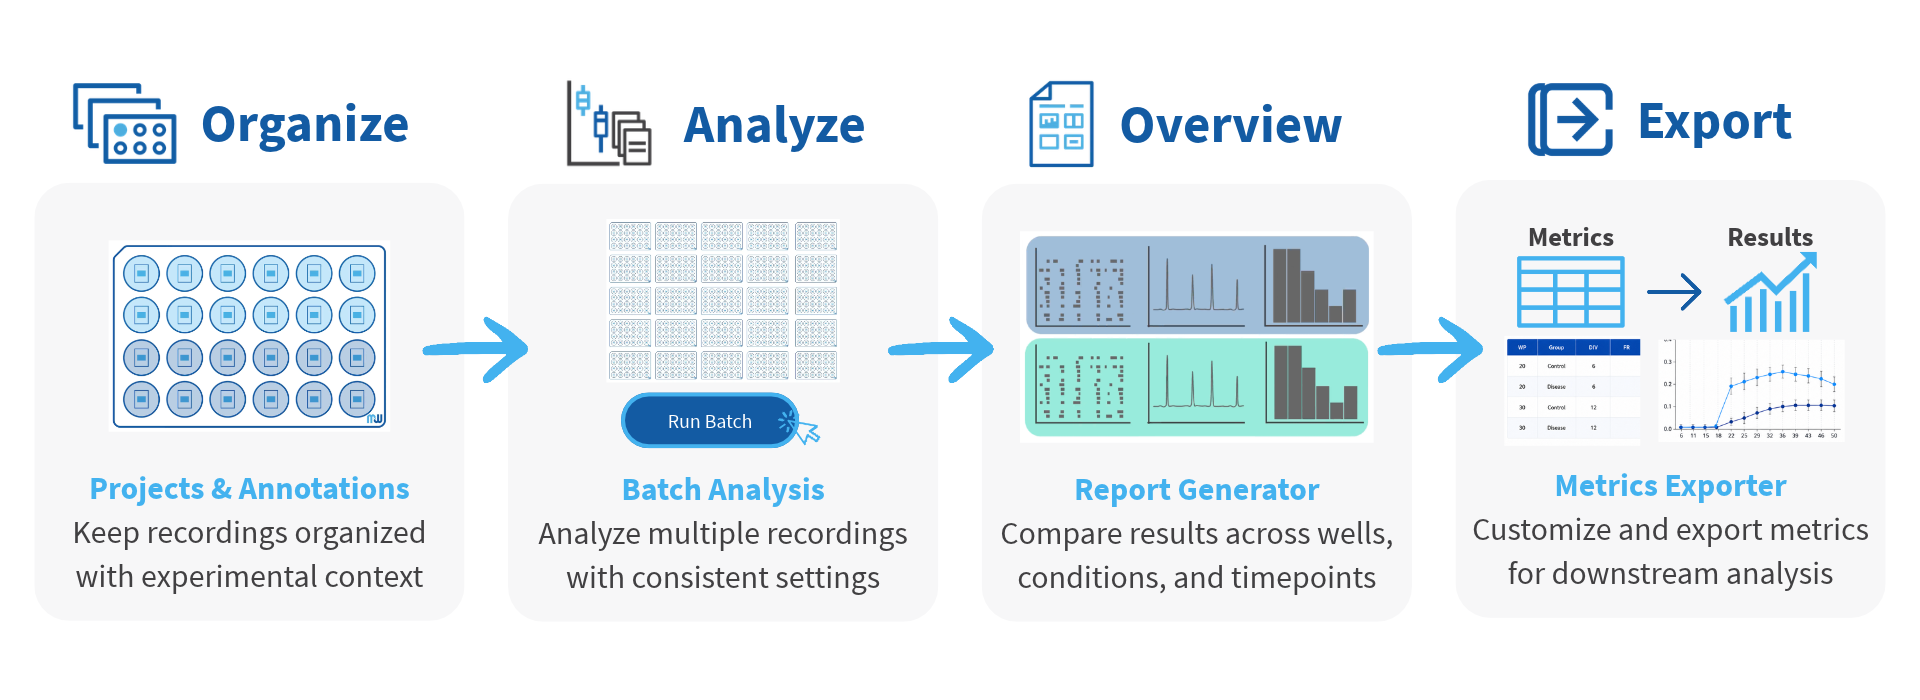
Organize: Projects and Annotations keep experimental context with the data
A longitudinal study on a 24-well MaxTwo plate, recorded twice a week for six weeks with two assays per session, already produces close to 600 well recordings. The information needed to interpret them – cell line, compound, dose, plating date – usually lives elsewhere: a lab notebook, an Excel plate map, a note on the lid. At scale, every analysis starts with reconnecting data to context, and a single mislabeled well silently ends up in the wrong group.
MaxLab Live helps to keep data organized in three ways:
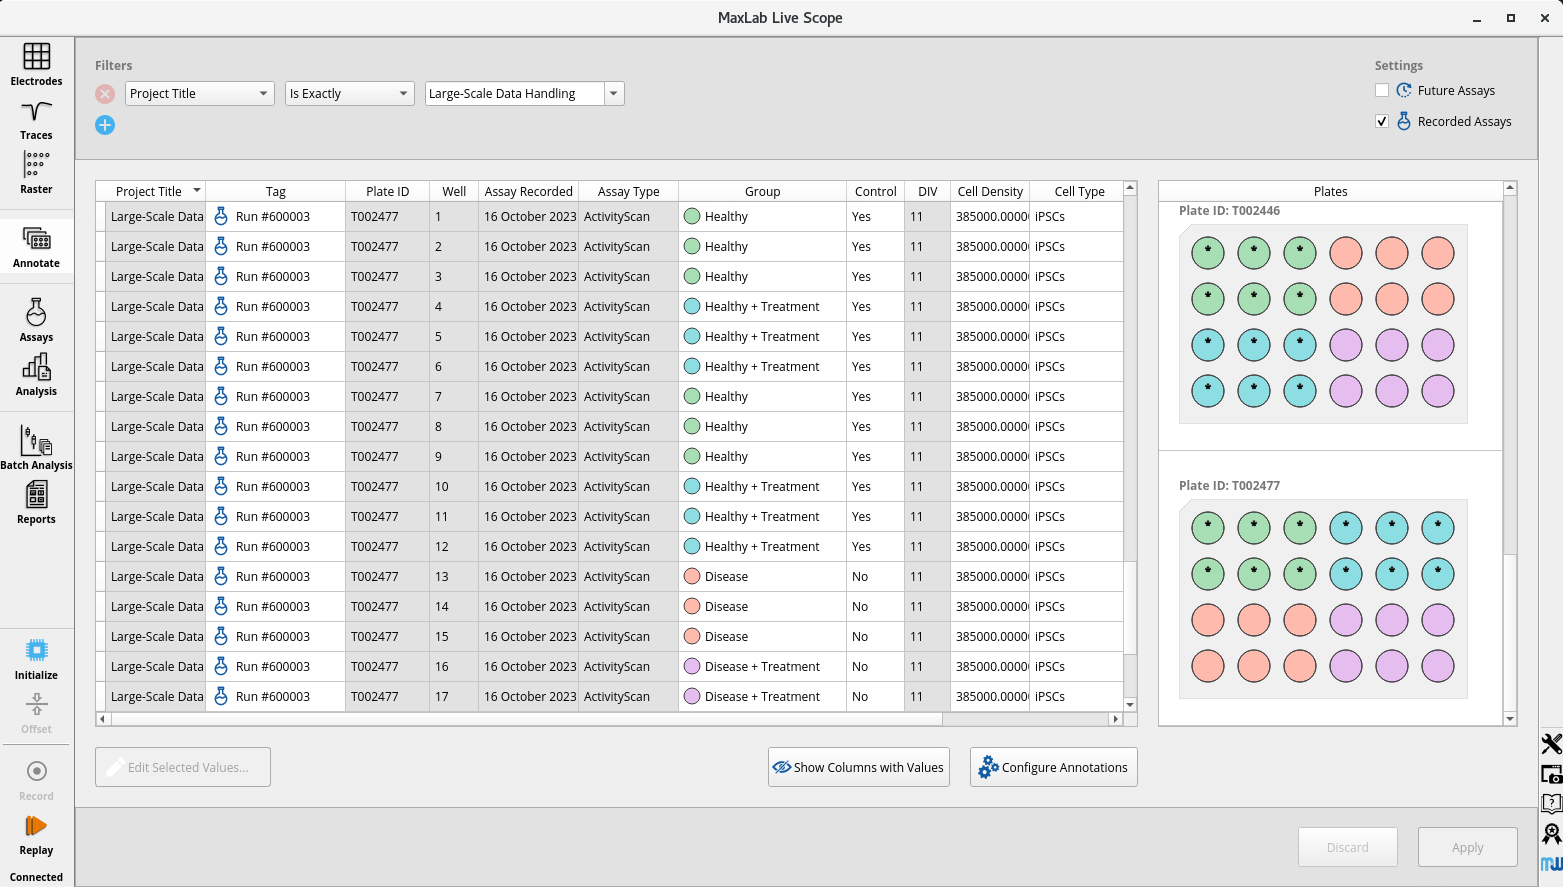
- In the right place. Projects are containers that keep recordings together that belong together, such as all plates and timepoints of one study.
- With the right information. Annotations store the experimental details directly with each recording and well, so the context travels with the data.
- Keeping the essentials visible. What you compare should be visible at a glance. MaxLab Live offers two special annotations for this: Group gives wells a name and a color, for example to set apart genotypes or treatments, and Control marks reference wells with an asterisk.
Analyze: Batch Analysis processes a whole experiment with consistent settings
MaxLab Live analyses turn assay recordings into quantifiable metrics: firing rates, burst statistics, axonal conduction velocity. But a scientific question is rarely answered by a single recording. An experiment brings many together: disease versus control, treated versus untreated, week one versus week six. To draw conclusions, all recordings of that experiment need to be analyzed consistently, ideally in one go.
Batch Analysis is built for exactly that:
- Choose what belongs together. Select the assays that make up your experiment, across well plates or individual wells, conditions and timepoints. The annotations come along, so results can later be compared between conditions.
- Set the analysis once. Define the analysis and plotting parameters for the whole selection, then run it. Every assay is processed with the same settings, and the results appear side by side.
- Burst detection without tuning. Burst detection is usually the hardest step to tune, because the right settings depend on the bursting profile. In MaxLab Live 26.1, the improved ISI-N burst detector infers its detection parameters automatically for every recording. Conditions with very different bursting profiles are analyzed with the same method, and their results stay comparable.
Overview: the Report Generator assembles results across wells, conditions and timepoints
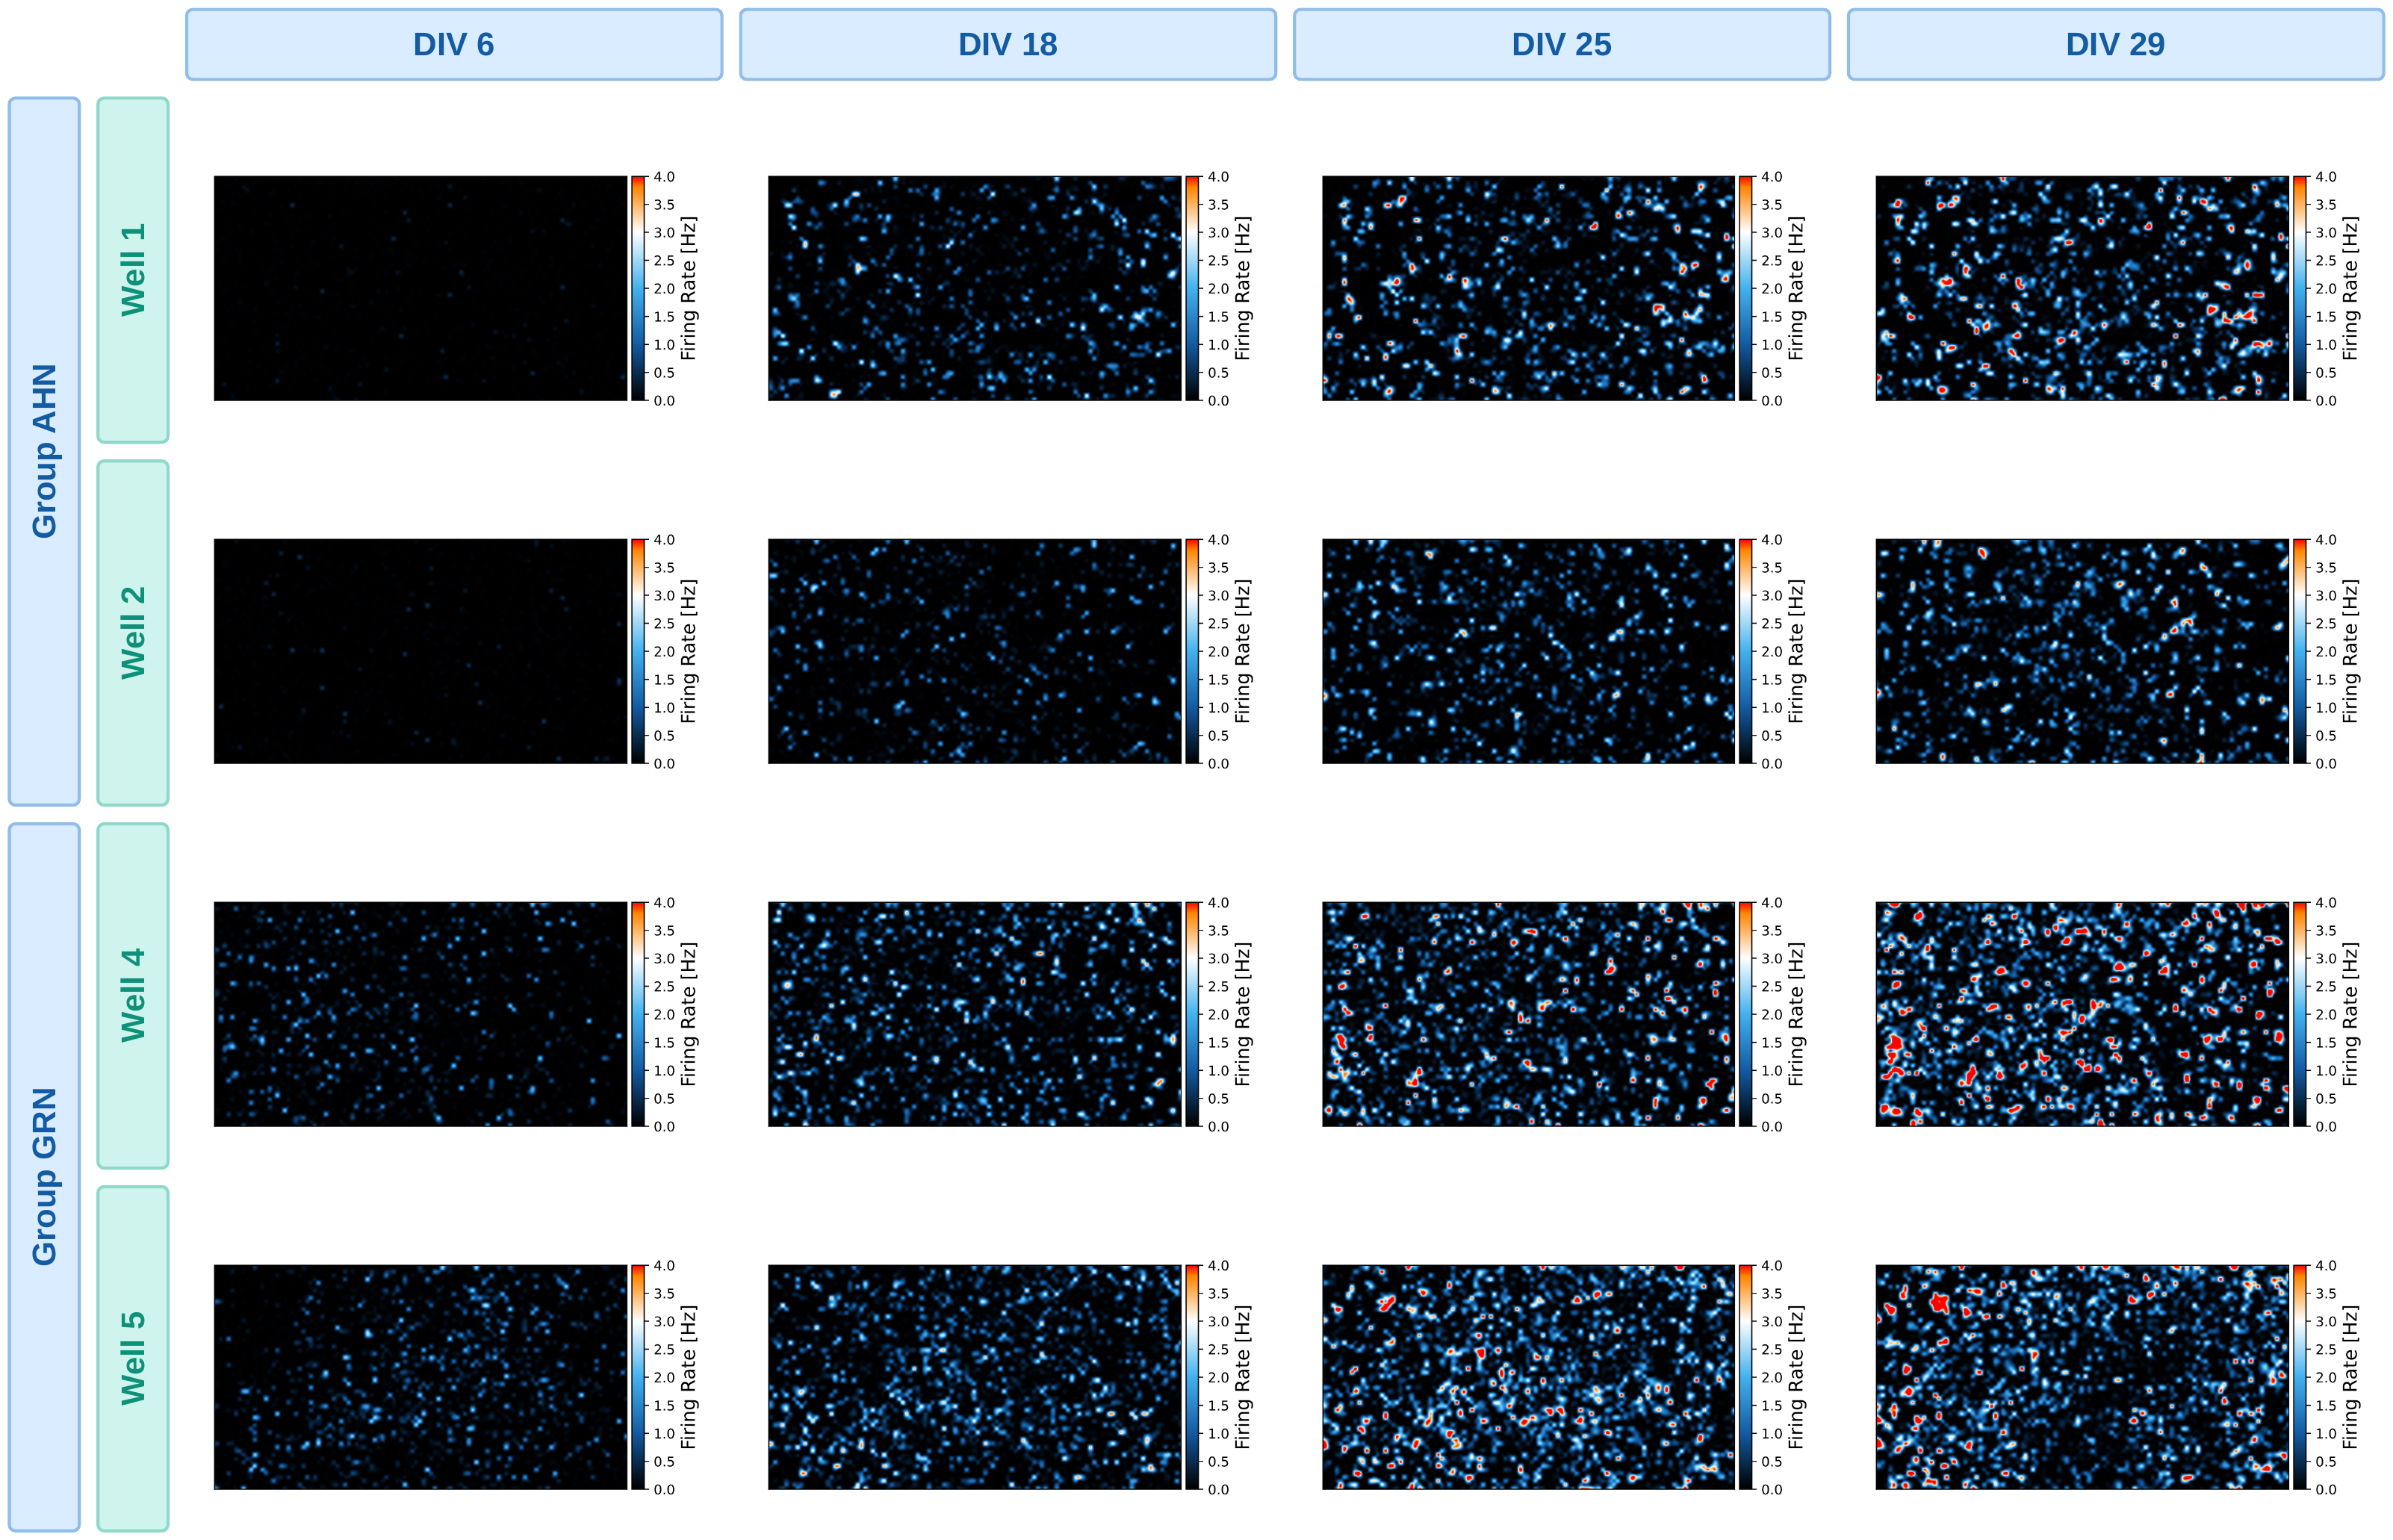
Beyond metrics, every analysis also produces plots, such as raster plots and activity maps: often the first thing you look at, and the figures that end up as representative results. Across a whole study, that quickly adds up to more figures than anyone can look through. Yet the questions are simple: how does network activity develop over time, and does it differ between conditions?
The Report Generator brings the results of an experiment together, so you can see the whole at once.
- Assemble one view of many results. Starting from a batch, you build the report step by step, choosing which results to show and how.
- Choose the view that fits your question. Three table types cover different needs:
- Well Plate table: results arranged like the plate
- Manual table: fully customizable
- Pivot table: you decide what belongs together, for example condition × recording date
- Produce a report. Turn the view into a report as PDF, PPTX or PNG, ready to share or discuss with colleagues.
Export: Metrics Exporter templates deliver the same format every time
The quantifiable metrics are what ultimately answers the scientific question. Typically exported from a Batch Analysis run, they are ready to be loaded into your own statistical workflow, whether in Prism, R, Python or Excel. But not everyone needs the same export: new users often prefer a focused set of metrics to get started, while experienced users may want the full set for in-depth analysis. The format varies too, from the file type to how the data is arranged. And once a format works, every following export should look the same, so the same script or Prism file keeps working as the experiment grows.
- Start with what matters. New in MaxLab Live 26.1, Key Metrics are a curated subset of the most informative metrics per analysis: a focused starting point, with the full set available whenever you need it.
- Set up your own template. With MaxLab Live 26.1, the Metrics Exporter becomes customizable. Choose the file format (XLS or CSV) and the layout your downstream tools expect, and save it as a template. Every following export comes out in exactly the same format.
- One set per timepoint. Also new in 26.1, different assays recorded on the same day can optionally be grouped into shared observations, with a single set of metrics per well and day.
One consistent workflow in MaxLab Live, from HD-MEA recording to insights
Large HD-MEA studies become easier to manage when each step builds on the last. MaxLab Live keeps experimental context together with the recordings, enables consistent analysis across wells and conditions, brings results into comprehensive reports, and support customizable data export for downstream analysis.
Together with the new neuronal and cardiac readouts introduced in MaxLab Live 26.1, these capabilities help researchers extract more information from every recording while efficiently handling hundreds of them.
More Than Data Analysis: One Platform for High-Content Electrophysiology
From experimental design to data interpretation, MaxLab Live brings the entire HD-MEA workflow together in one integrated software platform.
With dedicated assays such as ActivityScan, Network, Stimulation, and AxonTracking, researchers can investigate electrical activity across multiple scales, from individual neurons and axonal propagation to complex neuronal networks. Combined with MaxWell's high-resolution HD-MEA technology and flexible electrode selection, these capabilities support detailed functional characterization across neuronal models and experimental conditions. Whether investigating neuronal network development, disease-related phenotypes, compound responses, or cardiac function, MaxLab Live provides the tools to acquire, analyze, and interpret rich electrophysiological data.
With MaxLab Live 26.1, researchers can explore additional dimensions of biological function while benefiting from consistent, scalable workflows, from individual experiments to large-scale studies.
Are you interested in learning how MaxLab Live can support your network research?
Related
Resources
MaxLab Live
All-in-one Software
Our Technology
Multi-/Micro-electrode Arrays